Guest blog by Ig Ibert Bittencourt, IPP’23
The main lessons from this course were:
- Implementation is about people
- Complex problems demand learning every time to overcome the unknowns
- Building acceptance and authorization is as important as tackling the implementation challenge
- Iterate, iterate, iterate
- Implementation success is about celebrating small wins along the way
- Trust in the process
The challenge at hand revolves around the limited capacity of municipalities to address the complexities of education. This issue becomes even more pronounced when we focus on smaller municipalities, those with populations of fewer than 50 thousand residents. Notably, the smaller the municipality, the more acute the decline in students’ proficiency, as illustrated in Figure 1.
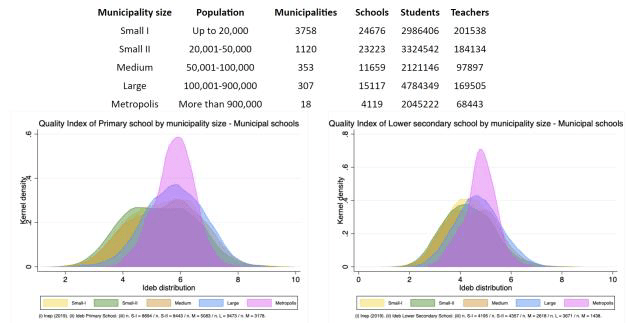
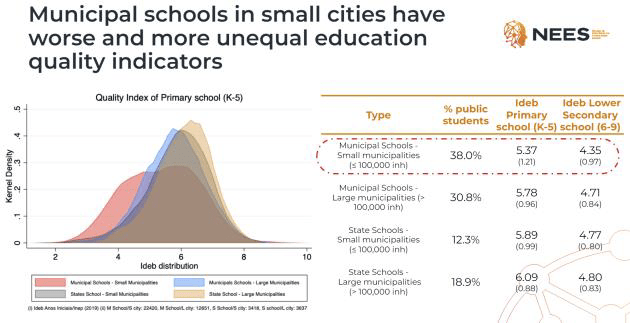
Figure 1. Learning outcomes comparing sizes of municipalities in Brazil
Here, I delineate the categories that somewhat encapsulate our progression, starting from grasping the challenges we confront in Brazil (as aforementioned), transitioning into formulating a program proposal, implementing a pilot utilizing the Problem-Driven Iterative Adaptation (PDIA) approach to yield results and enhancements, and ultimately the expansion of our efforts to additional municipalities.
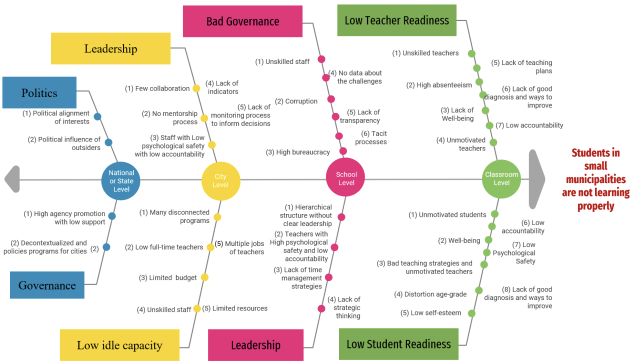
The Problem – Students in small municipalities in Brazil are not learning properly.
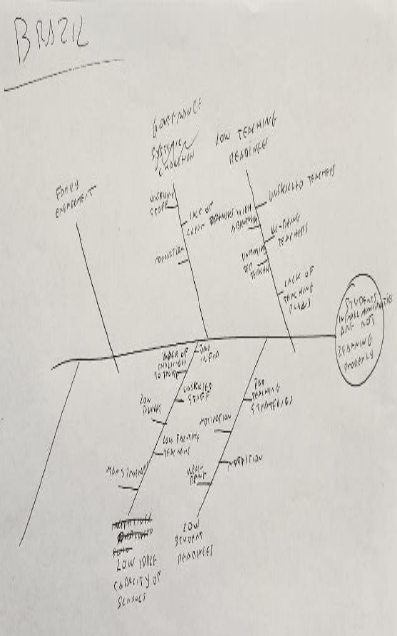
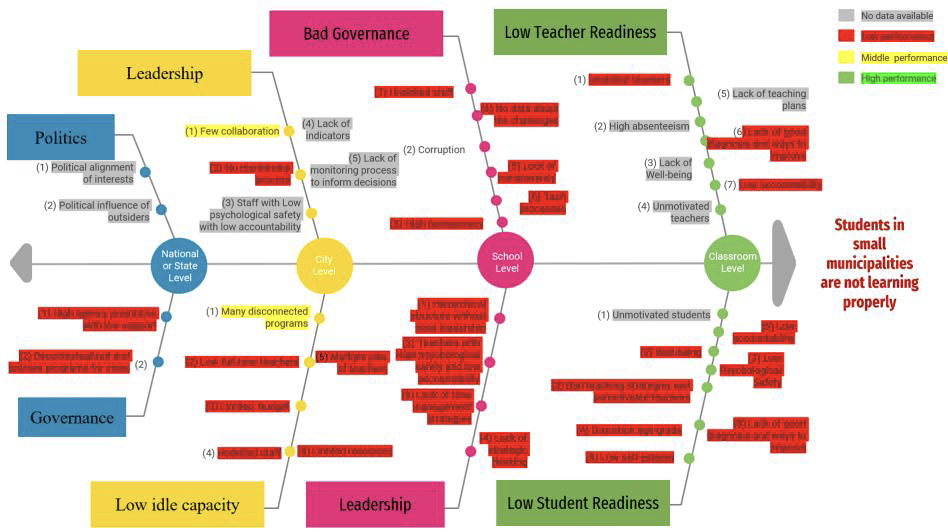
The improvement of national educational policies is crucial to address the challenges in reaching all students effectively. It is worth noting that a significant majority of municipalities in Brazil, approximately 94.15% are small in size (less than 100 thousand habitants). These municipalities are home to 38.01% of the total student population up to K9, amounting to nearly 8.5 million students. This statistic is particularly important because students who do not receive a proper education are likely to encounter difficulties leading a fulfilling life and are ill-prepared to face the challenges of the 21st century. This is a problem of great concern to all stakeholders involved in the education system, most notably the students themselves, the teachers, and the parents. Below is presented the first Ishikawa diagrams (see Figure 2).
The Proposal
Having devoted nearly a decade to collaborating with the Brazilian Ministry of Education, we’ve come to the realization that many of their policies and programs tend to fall within the category of “controversy without impact,” rather than facilitating genuine transformation. These initiatives typically follow a top-down approach, operating at a considerable remove from the frontlines, namely schools, teachers, and students. This distance from the core stakeholders often results in program discontinuity, giving rise to the formidable “last-mile challenge,” where policies and programs falter before reaching the intended recipients, especially in smaller municipalities with populations of fewer than 100,000. Since the small municipalities are those with more problems regarding budgets, unskilled professionals and lack of good educational indicators, the need to develop more capabilities than other municipalities. As a result, it is expected to face a complex system in most of the municipalities.
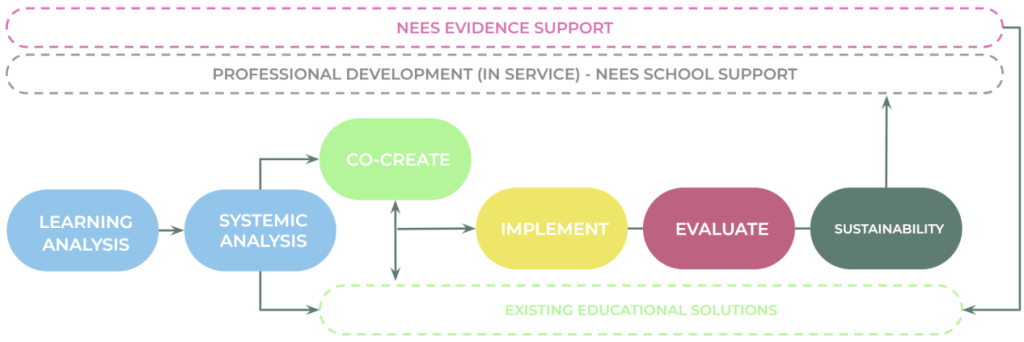
The program is named the “Educational Equity Journey,, as presented in Figure 3” and it comprises a series of macro phases, each of which encompasses several iterations and learning and leadership activities. The initial two phases, “Learning Analysis” and “Systemic Analysis,” serve the purpose of evaluating and diagnosing a municipality’s capacity for effecting transformative change within their educational landscape. The “Co-Creation” phase is designed to foster the engagement of multiple stakeholders from the education sector in order to collaboratively propose solutions for the challenges identified.
Following this, the “Implementation” and “Evaluation” phases come into play, allowing for the practical execution of the proposed solutions and the continuous assessment of their effectiveness. Finally, the “Sustainability” phase materializes when the municipality’s team has developed the necessary capabilities to independently run the program without reliance on our external support.
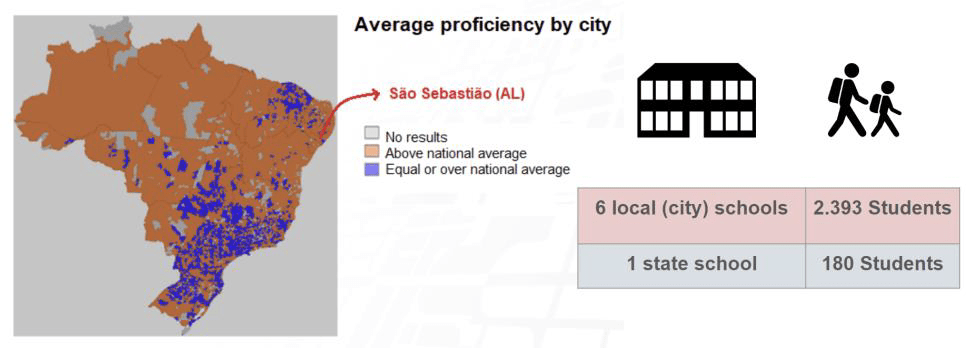
The Context for Pilot – City of São Sebastião
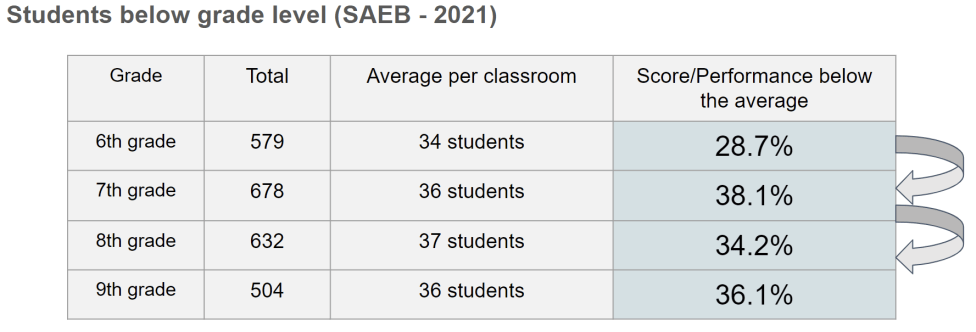
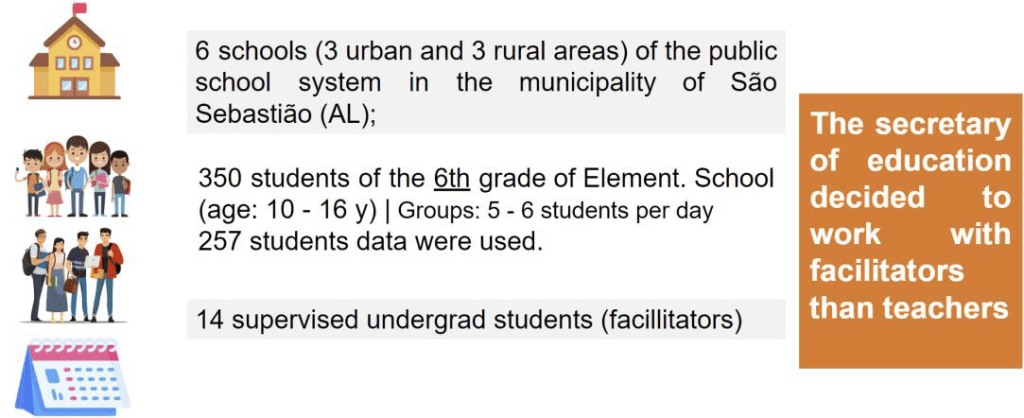
The development and piloting of the program were carried out in collaboration with the City of São Sebastião, situated in Alagoas, Northeast Brazil. This city, with a population of approximately 44 thousand residents, is home to 33 schools, serving around 7,500 students. The implementation of the program initially took place in six of these schools (see Figure 4a). It is noteworthy to highlight that these schools had been consistently underperforming in national education assessments, particularly in the areas of K5 and K-9, called SAEB (see Figure 4b), and Foundational Literacy and Numeracy.
Problem Challenge in São Sebastião and Space change
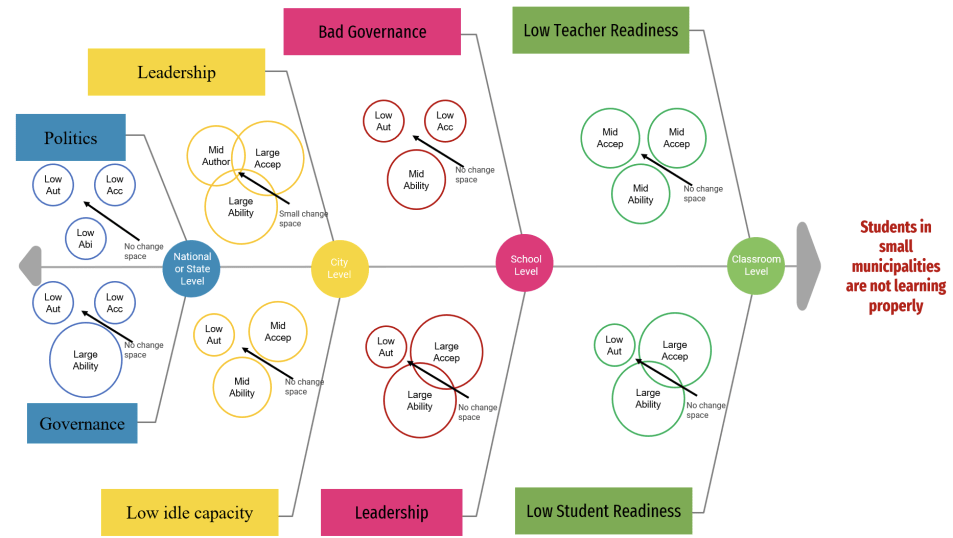
Following our comprehensive understanding of the challenges faced in São Sebastião (Figure 5), and subsequent to the learning and systematic analysis phases, we proceeded to assess the levels of acceptance, authorization, and capacity (Figure 6).
Piloting – Phase 1
It’s important to note that our space change was initially quite limited, focusing primarily on a few overarching causes. Consequently, we made a deliberate choice to concentrate on securing authorization at the city level and then progressively extend it to other levels, particularly within the school system, ultimately reaching the classroom.
As part of this strategy, we opted to initiate a pilot program involving six schools and approximately 250 students from the 6th grade. Our initial step was to assess the students’ foundational literacy levels, as depicted in Figure 7, to gain a clear understanding of their starting point.

It was identified that around 30% of the students barely know how to write their names (see Figure 8). For this reason, we could only work with a small amount of students. Additionally, we did not have change space in the level of the school and the classroom, therefore, we secretary of education hired paraprofressionals to work in the program and the intervention with students happened outside classroom.
Results Phase 1
Throughout the implementation phase, we encountered various challenges and gleaned valuable lessons. One noteworthy example was the inadequacy of available infrastructure to effectively execute the Teaching at the Right Level model. As a result, motivated students who participated in the program began to disrupt regular classroom activities when they returned after their interventions. This understandably created tension between these students and their teachers. However, it also piqued the curiosity of the teachers about the program.
Furthermore, as students acquired new skills through the program, such as improved argumentation abilities, they began to question and challenge certain established norms within the school, contributing to a dynamic shift in the status quo. Some of the results are presented in Figures 9, 10, and 11.
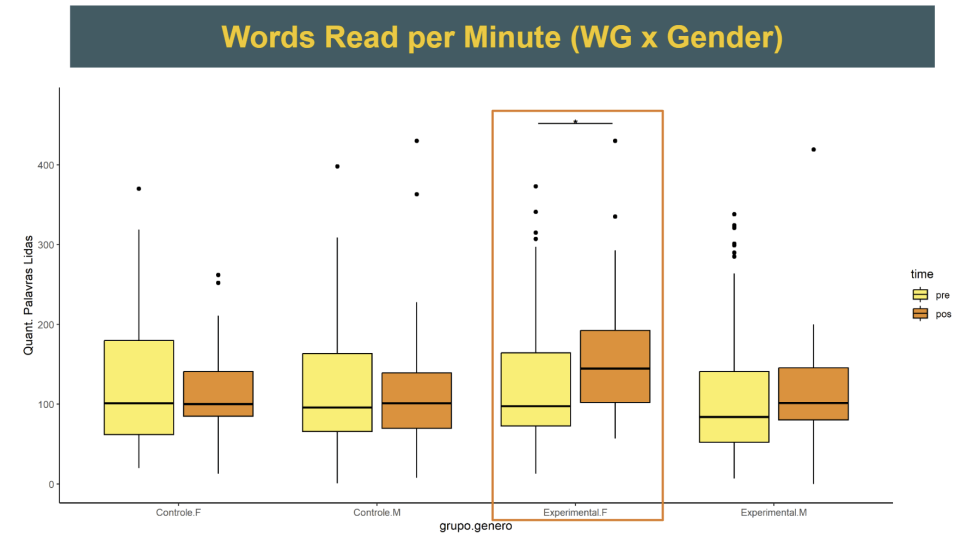
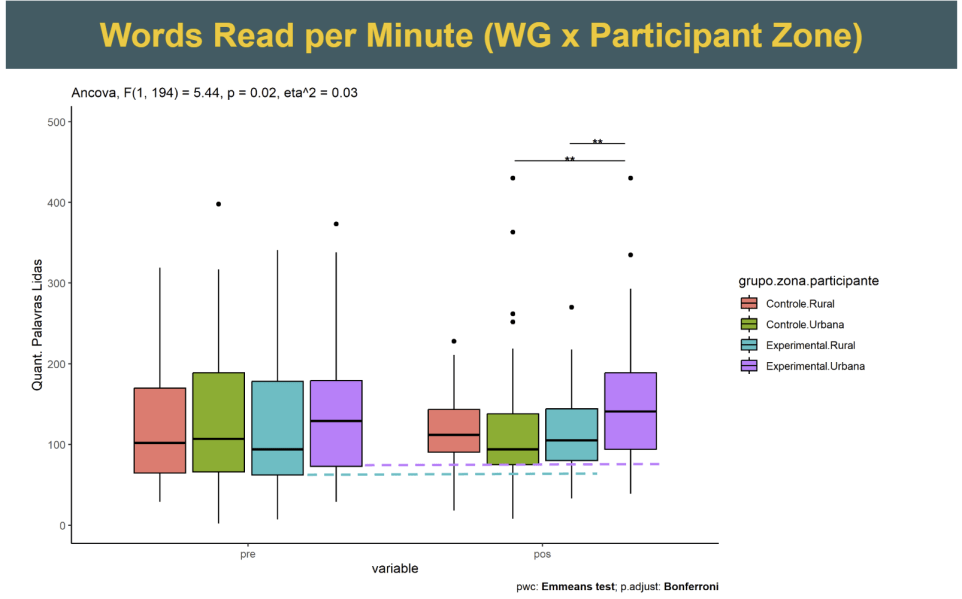
Figure 10. Plot presenting statistical significance urban schools students in words reading.
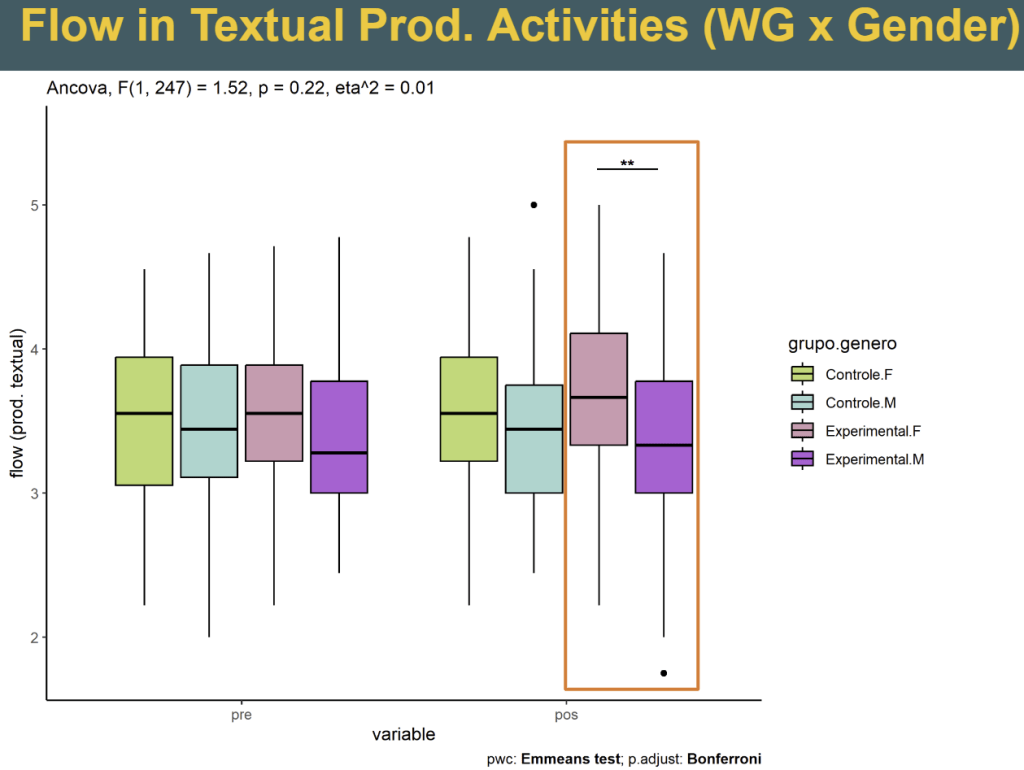
Figure 11. Plot presenting statistical significance of Flow state (well-being) female students during textual production.
With the results in our possession, we were able to conduct a comprehensive analysis using an Ishikawa diagram, which helped us visualize and understand the root causes of the problem at hand (refer to Figure 12). This, in turn, enabled us to develop a clear and structured strategy to address these underlying issues and make meaningful progress to build authorization and acceptance, allowing us to increase our change space.
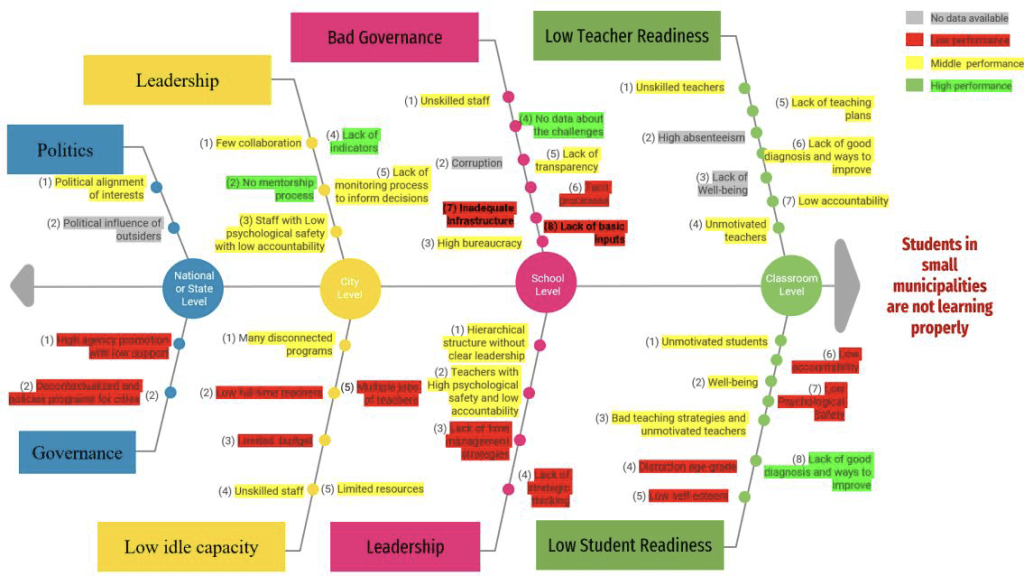
Figure 12. Revisited Ishikawa Diagram after piloting for few months.
During this workshop we did with the City of São Sebastião, two key moments of communicating our lessons and leads were:
- Communicating results from learning analysis: Since we are running a local analysis of the problem and improvement of learning in the City of São Sebastião, we presented the results from learning analysis regarding well-being, improvement of students’ vocabulary, and gender equity promotion, as presented in Figure 13.
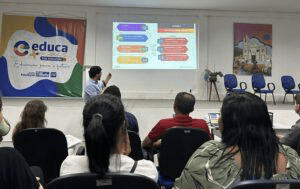
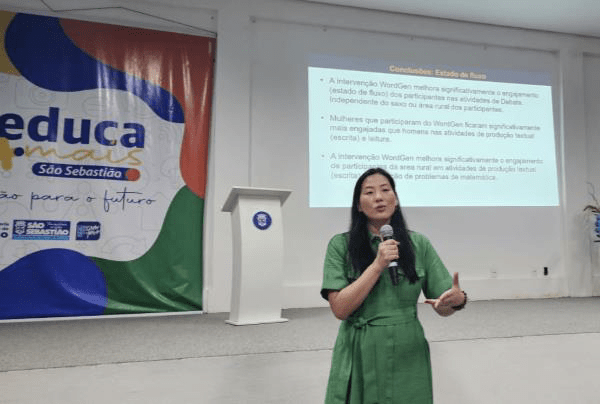
Figure 13. Photos of the workshop
- Reaching new leads and building acceptance through systemic analysis: This part of the workshop was focused on the school level in order to build authorization and acceptance and work towards having a small change space.
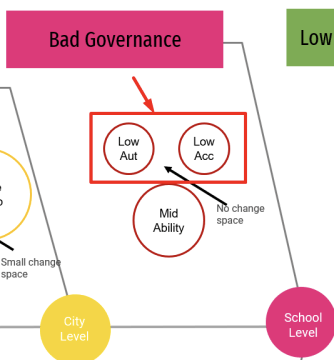
Figure 14. Need for creating change space
We did co-creation analysis of the strengths and weaknesses of the education in São Sebastião with almost 50 school leaders.
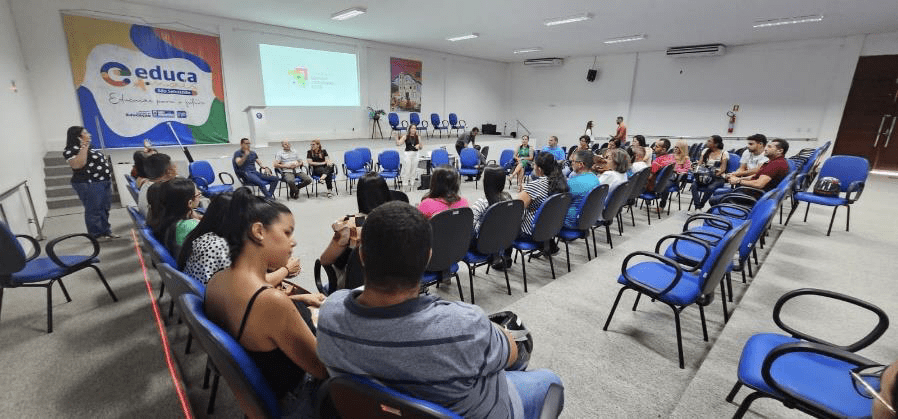
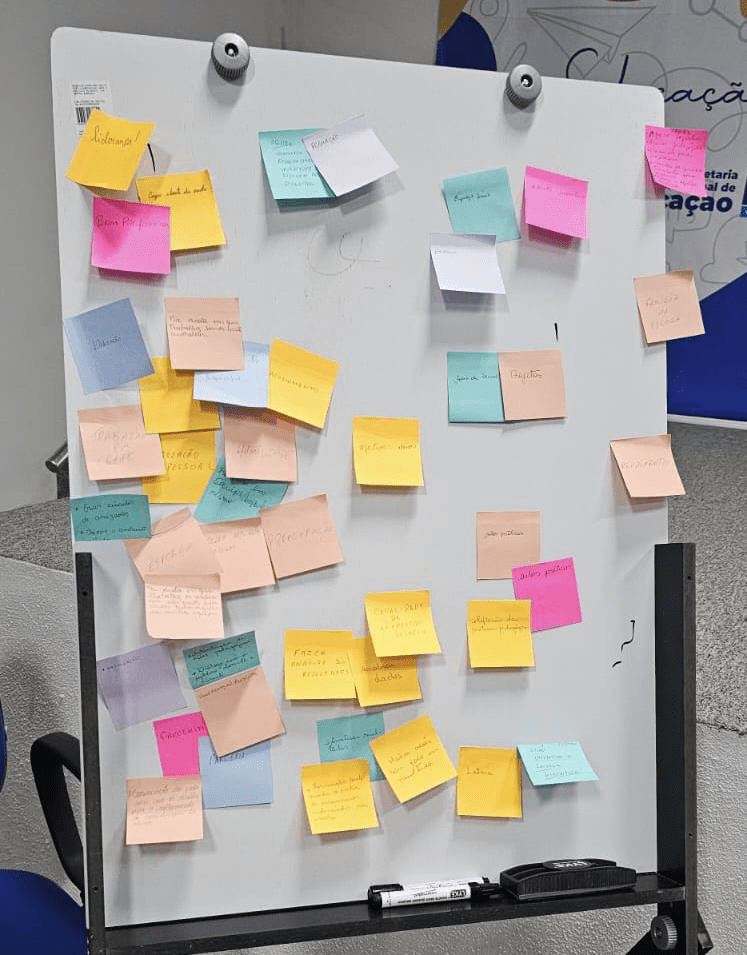
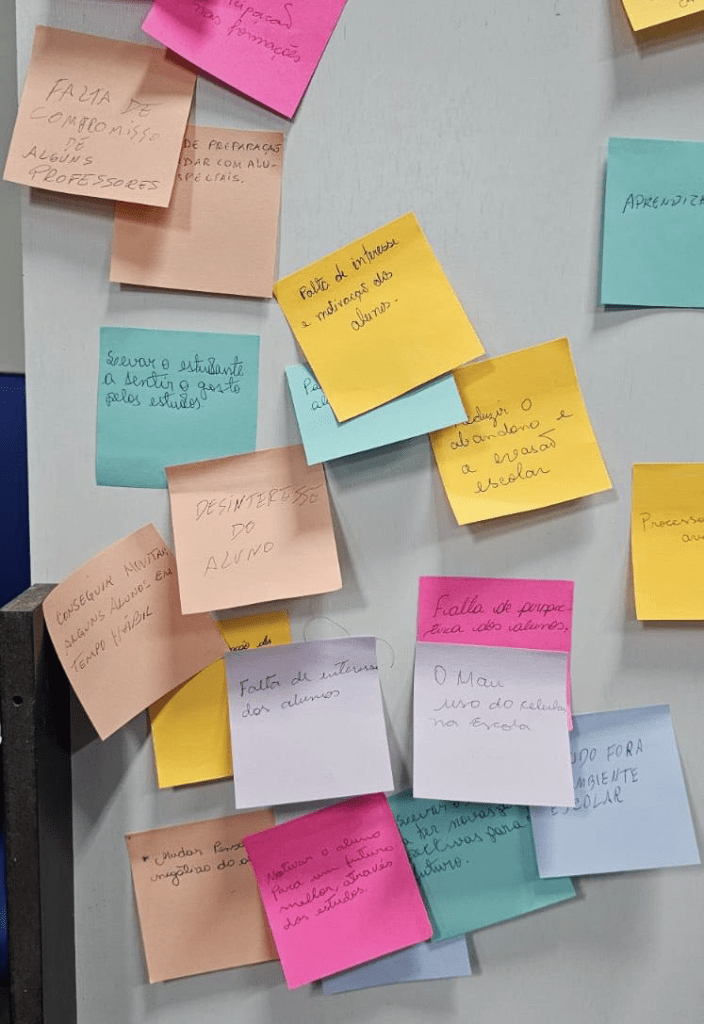
Figure 15. Photos with the results of the co-creation analysis
News about the workshop can be found here.
Piloting Phase 2
Following the initial workshop, we embarked on the second phase of implementation. Another workshop was conducted to gauge teacher interest in participating in the program, and the response was highly encouraging. Several teachers enthusiastically joined the initiative, marking a pivotal moment in our journey. As we progress into the second phase of implementation, we’re delighted to announce that we now have the acceptance and authorisation of 110 teachers, which translates into 24.7% of the city’s total teacher population. We are now working with 1,900 students from grades 6 to 9 with 63 groups in the whole classroom. This critical development allows us to directly engage with students at the classroom level, representing a significant milestone in our journey.
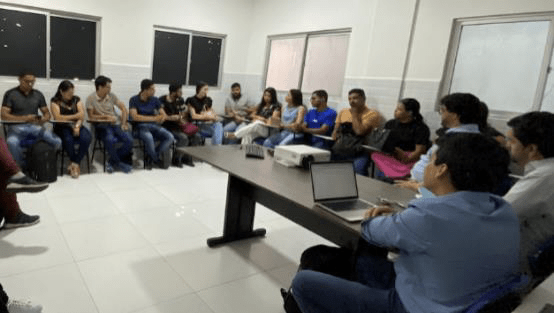
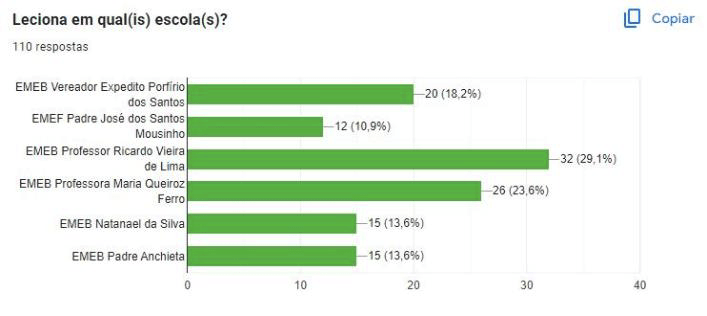
Figure 16. Meeting with teachers and survey to know teachers’ interest to participate in the program.
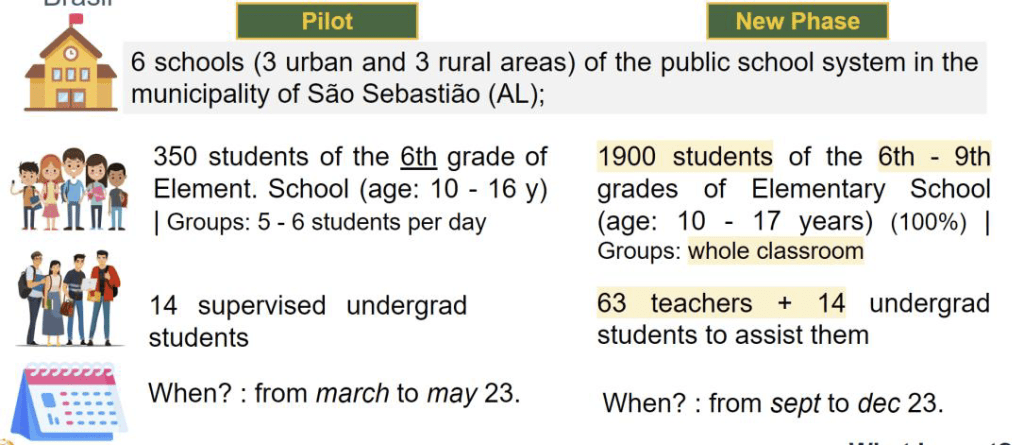
Figure 17. Comparison between phases 1 and 2
With these remarkable results, we were prompted to revisit and reevaluate the extent of change space we’ve managed to create (Figure 17).
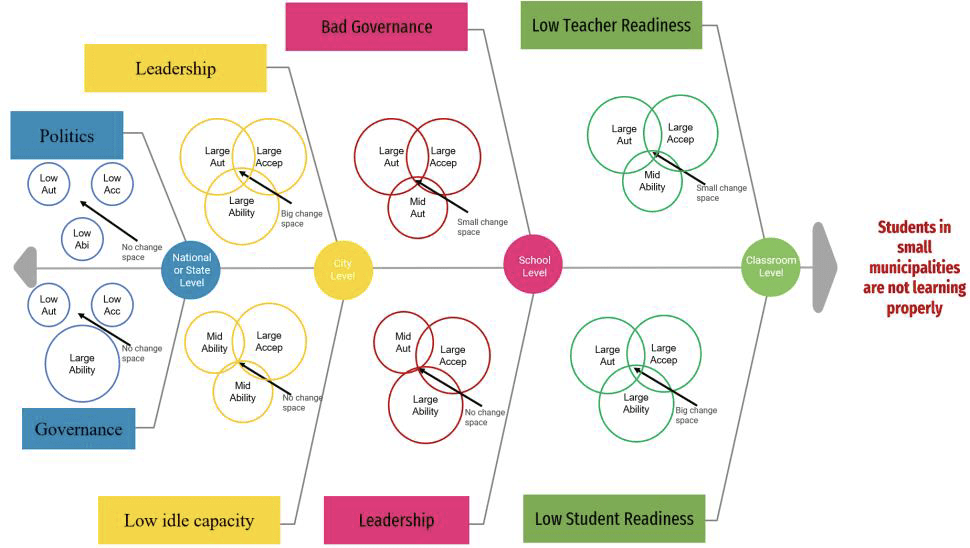
Figure 17. Revisited Triple A analysis
PDIA has changed my approach to tackling policy challenges. Previously, I employed a method centered around planning and control, lacking clear milestones to acknowledge incremental successes. Moreover, while I recognized the significance of engagement, PDIA provided a crucial tool for assessing the degree of acceptance and authorization within a policy, transforming how entry points to the policy are established.
PDIA has already initiated a transformation in the implementation of new policies within my center. As an illustration, we have developed a toolkit inspired by the PDIA approach and are actively applying it to various other policy initiatives.
Margaret Mead once said: “Never doubt that a small group of thoughtful, committed citizens can change the world; indeed, it’s the only thing that ever has”. My dear fellow PDIA practitioners: “Trust in the process and make a positive change in the world”
This is a blog series written by the alumni of the Implementing Public Policy Executive Education Program at the Harvard Kennedy School. 47 Participants successfully completed this 7-month hybrid program in December 2023. These are their learning journey stories.