
Guest blog by Pheakkdey Nguon
Often times, as a technical expert, I am brought into a situation to try to address a policy problem, for example, illegal deforestation and its associated trade. The expectation is to get to the solutions or to be at a place where feasible recommendations for moving forward toward solutions are identified, after a few hours to a few months of working on the problem (this in general means discussing potential solutions) with counterparts. In this work environment, we hardly go deep into understanding why the problem is the problem and for whom. The expectation is not to unpack or deconstruct the problem – the priority is to propose solutions that can be technical and/or political in nature. In fact, everyone is expected to come into the discussion room already with at least a comprehensive understanding of the problem, if not a list of solutions that they are eagerly ready to negotiate.
In this context, what I appreciated most from the course over the last several months is the importance of understanding the problem by asking the question why five times or as many times as we feel sufficient for us to understand the causes or sub-causes of the problem. What has been clear to me through the case studies examined in the course was that solution-driven discussions, while it sounds very attractive to policymakers, have the potential downfalls of creating new problems because solutions that ended up being picked might not be driven by a complete understanding of the problems in question.
Or, that the popularity of the solutions was the main reason why they were selected and not because they address the problem. For example, in my context, a very popular solution to illegal logging and its associated trade is to enhance regulatory enforcement particularly in the forestry sector. One can arrive at this solution without even the need to discuss the problem in its contextual setup. On the other hand, the PDIA approach would require that one starts by asking why illegal logging and its associated trade is the problem. And for each answer, the PDIA implementer would ask why is that the case/ or why does that happen, so on and so forth.
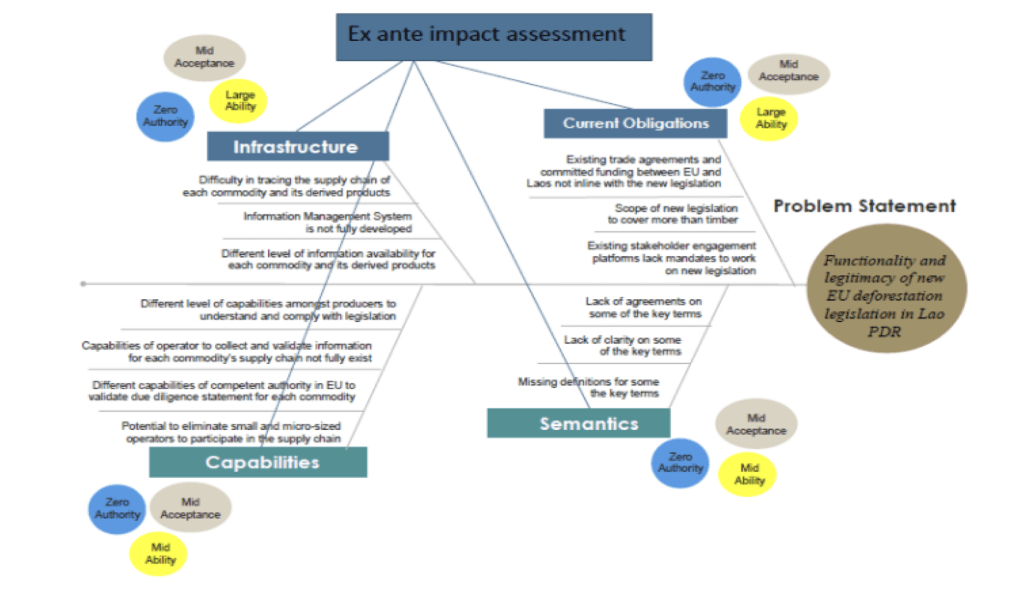
Furthermore, once the causes and sub-causes were identified, the second valuable takeaway for me from the course has been the Ishikawa or fishbone diagram. This is because not only that the diagram is a simple way to visualize the causes and sub-causes of the problem, it can also be a powerful and super-efficient way to communicate the causes of the problem particularly to policymakers who might have a minute to look at the diagram and not 1 hour to read a briefing.
I also like that the diagram can also be flexible and open to capturing other important aspects such as the triple A change space. We have also seen instances where the fishbone could be flipped from visualizing the problems to visualizing what would be needed for solutions. From my experience, the fishbone has been a very useful means to generate discussions with my colleagues and clients. For example, when I shared my fishbone with my colleagues and clients, I did not have to explain much because the visual is quite self-explanatory. What I recorded as causes or sub-causes of the problem in the diagram also served to structure our conversations.
There are however two particular challenges that I would like to highlight in using the PDIA’s problem deconstruction and the fishbone diagram. Starting with problem deconstruction, the main challenge that I encountered trying to implement the 5 whys or to dig deeper into the problem is the resistance from my colleagues and my clients for deviating from the business as usual. The initial reactions were – why are we wasting time talking about the problem when we know what is the problem or when we already knew what causes the problem? You are paid to come up with solutions and not to keep asking about what causes the problem?
To address this particular challenge my strategy was to be open to follow the business-as-usual scenario where discussions were on potential solutions. However, I made conscious attempt to steer the conversation around potential solution to ask what aspect of illegal deforestation and its associated trade that we are trying to address with selected solutions. Making these linkages enable the discussions to shed some lights on what really are understood to be the causes or sub-causes of the problem.
My strategy was also to draw the fishbone diagram out of these conversations so as to communicate that the diagram was a summary of the discussions and that we all contributed to it. I do not think that it would have worked if I have brought the fishbone diagram into the conversation at the beginning. It is more important in my case that the fishbone diagram was presented as a result of the discussion so as to create a sense of ownership by those involved in the discussions. This also meant that I had to volunteer as the minute taker for these meetings.
In terms of the fishbone diagram, a key challenge for me was trying to come up with the right phrasing to capture the causes and sub-causes in a way that would be engaging for my colleagues and clients. Because it is a diagram that is limited by the four corners of an A4 paper, finding the right phrasing for the causes and sub-causes was challenging. My way of dealing with this challenge was to iterate the phrasings based on feedback from my colleagues/ clients as well as reassuring them that perfect phrasing for the causes and sub-causes were not the goal of the discussions. The goal was to have conservations on the problem and to understand the extent to which selected solutions would address the causes of the problem.
I would sum up my experience from the PDIA, particularly on the importance of problem deconstruction with this quote from Einstein that, “If I were given one hour to save the planet, I would spend 59 minutes defining the problem and one minute resolving it.” In addition, I would capture the outcomes of the 59 minutes in a fishbone diagram and iterate on each of the bones several times.
Note: I updated my fishbone diagram with a solution bone that was recently agreed by EU and Laos to try to answer the question of what supports would be needed to ensure the functionality and legitimacy of the new EU legislative proposal on deforestation and forest degradation in Laos, considering the existing processes in-country.
This is a blog series written by the alumni of the Implementing Public Policy Executive Education Program at the Harvard Kennedy School. Participants successfully completed this 6-month online learning course in December 2022. These are their learning journey stories.